Do Hard Risk Limits Earn Their Cost?
Testing H8 — deterministic caps and budgets turn an untradeable strategy into a viable one, and not every limit works
H8 completes the proposal’s hypothesis trilogy: hard risk constraints improve stability and viability even where they cut gross returns. Imposing the Risk Agent’s deterministic limits on an aggressive 2× Nasdaq strategy takes its drawdown from −63% to −26% at a return cost — but the test also shows which limits earn their keep (leverage caps, volatility budgets) and which backfire (drawdown kill-switches).
Research question
The last of the proposal’s three load-bearing hypotheses, and the counterpart to the risk-constrained-RL entry, where an agent that wanted 6.3× leverage was capped to 1.41× by a hard CVaR budget. H8 claims that hard, deterministic risk constraints improve stability and practical viability even where they reduce gross returns. It is not a return claim — quite the opposite — so it cannot be tested by Sharpe alone. The question is whether imposing inviolable limits on an aggressive strategy buys enough stability (bounded drawdown, thinner tails, tradeable, no ruin) to be worth the return it sacrifices, out of sample. And, because the multi-agent credit-assignment test already warned that a naive drawdown-stop can destroy value, a second question: do all hard limits earn their cost, or only some?
Hypothesis
H: hard limits substantially reduce drawdown and tail risk and make an otherwise-untradeable strategy viable, at a real cost in gross return — so they improve risk-adjusted and practical-viability metrics (Calmar, tail CVaR, ruin avoidance) even as CAGR falls. And I expected the limits to divide: a leverage cap and a volatility/CVaR budget to earn their cost, but a reactive drawdown kill-switch to add little or backfire, because it can only ever sell after a loss.
Data & method
Daily Nasdaq-100 returns, 2015–2026, out-of-sample from 2016, net of costs. The unconstrained base is a deliberately aggressive 2× leveraged long — a strategy with no risk management, the kind an unconstrained optimiser or a return-maximising RL agent would choose. The Risk Agent’s hard limits are then layered on, each deterministic and inviolable:
- Leverage cap — exposure \le 1.5\times, a hard bound on position size.
- Volatility / CVaR budget — scale exposure so predicted daily volatility stays within a budget (≈ 17.5% annualised), the empirical form of the risk-constrained-RL constraint.
- Drawdown kill-switch — halve exposure after a trailing drawdown breaches −20%.
Each strategy is judged on the full stability suite — maximum drawdown, annualised volatility, 95% daily CVaR (expected shortfall), worst day, time underwater — alongside return (CAGR) and viability ratios (Sharpe, Sortino, Calmar). To see which limit does the work, I add them one at a time and also test the kill-switch in isolation. All computed and verified in the sandbox.
Results
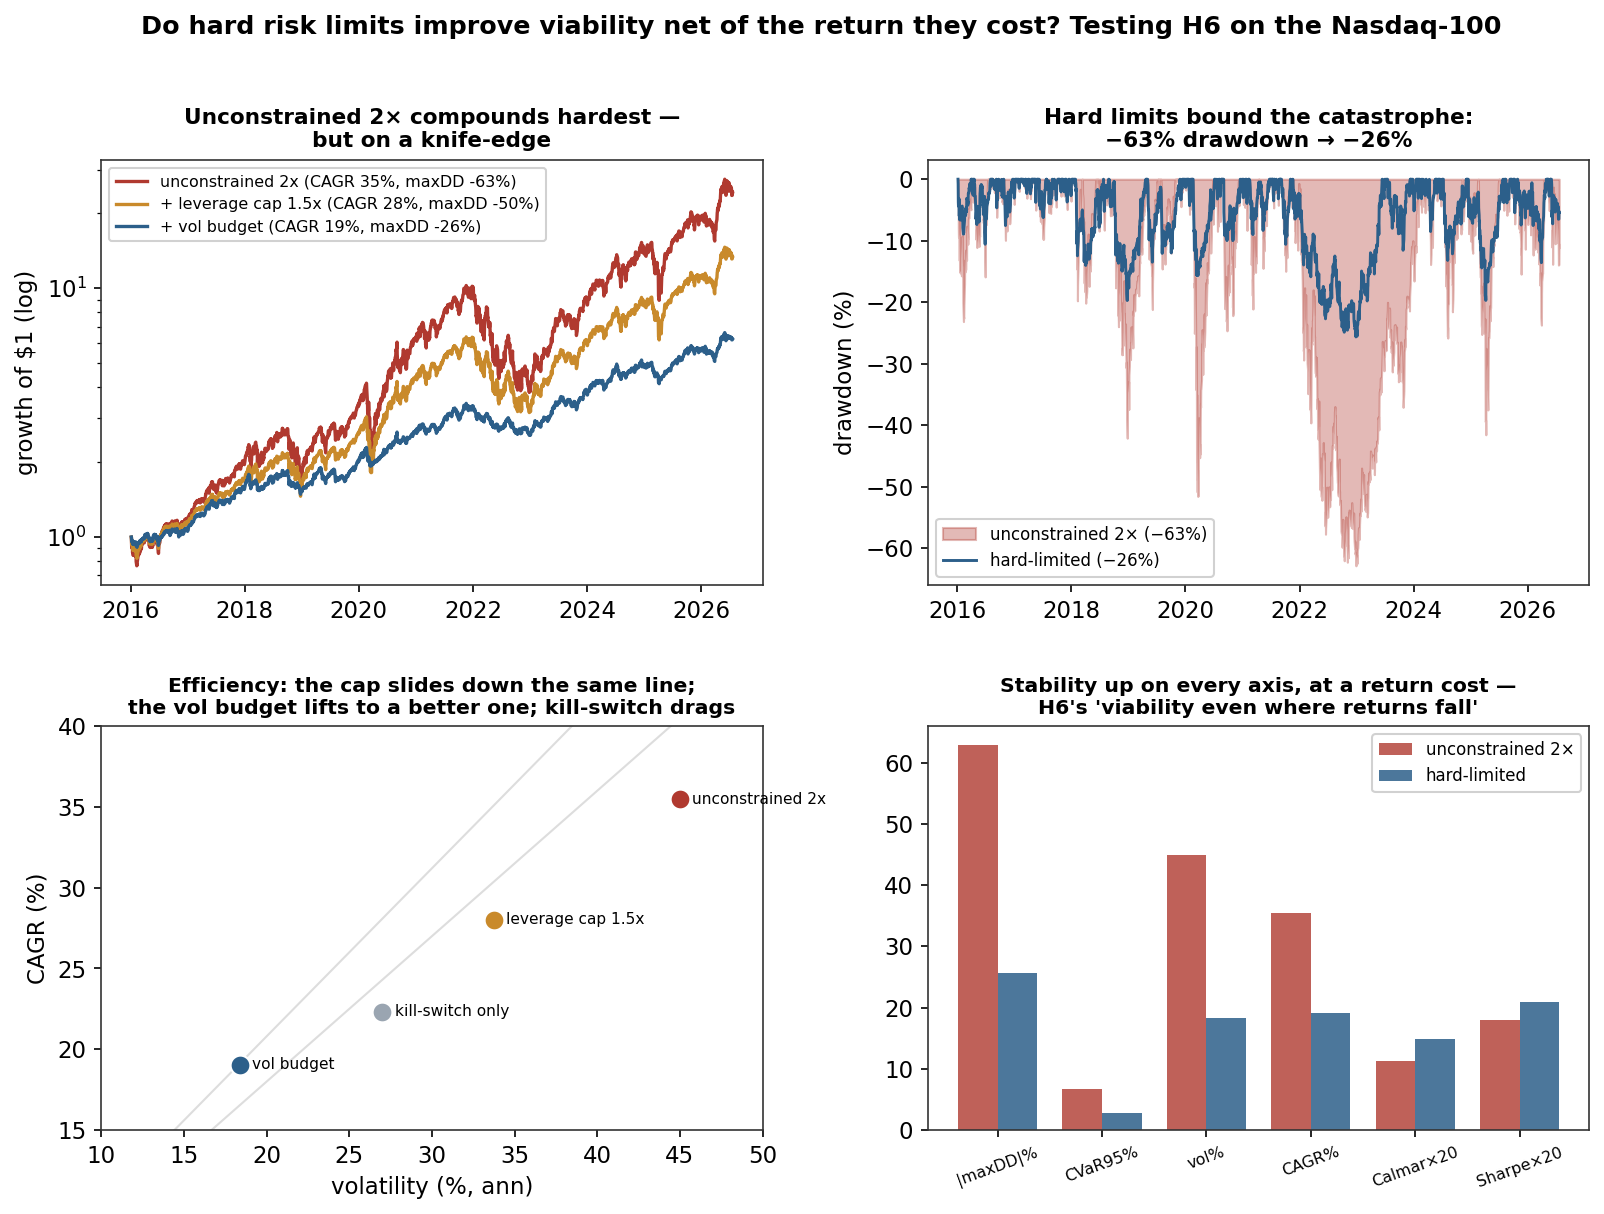
H8 holds emphatically: the limits make an untradeable strategy viable. The unconstrained 2× posts a seductive 35.5% CAGR — and a −63% maximum drawdown on 45% volatility, with a 95% daily CVaR of 6.8%. No one can hold that; it is a strategy that looks brilliant until it takes two-thirds of your capital. The full hard-limited version cuts the drawdown to −26%, volatility to 18%, and CVaR to 2.8% — less than half the tail — while giving up return, CAGR falling to 19%. Crucially the viability ratios improve: Sharpe rises 0.90 → 1.04, Sortino 1.15 → 1.36, Calmar 0.56 → 0.74. This is H8 exactly: stability up on every axis, gross return down, and the strategy transformed from a knife-edge into something a desk could actually run.
But the limits divide sharply — and only some earn their cost. Adding them one at a time separates two entirely different kinds of value:
| Strategy | CAGR | maxDD | Vol | CVaR₉₅ | Sharpe | Calmar |
|---|---|---|---|---|---|---|
| Unconstrained 2× | 35.5% | −63% | 45% | 6.8% | 0.90 | 0.56 |
| + leverage cap 1.5× | 28.0% | −50% | 34% | 5.1% | 0.90 | 0.56 |
| + volatility / CVaR budget | 19.1% | −26% | 18% | 2.8% | 1.04 | 0.74 |
| drawdown kill-switch (alone) | 22.3% | −38% | 27% | 4.3% | 0.88 | 0.58 |
The leverage cap is a pure worst-case guarantee: it slides the strategy down the same efficiency line — drawdown −63% → −50%, CVaR 6.8% → 5.1%, all proportional, Sharpe and Calmar unchanged. It buys no efficiency, but it guarantees the catastrophe cannot exceed a known bound, which is exactly what a hard limit is for. The volatility/CVaR budget does more — it lifts the strategy to a better efficiency line (Sharpe 0.90 → 1.04, Calmar 0.56 → 0.74), because it de-levers specifically in the high-volatility periods that carry the losses. But the drawdown kill-switch is the dud my hypothesis predicted: layered on top of the volatility budget it changes nothing (the budget has already de-risked before any drawdown gets deep), and in isolation it lowers the Sharpe ratio (0.90 → 0.88) — it cuts risk but at a risk-adjusted loss, because a reactive stop can only sell after the fall and often sells the bottom. That is the second independent confirmation, after the multi-agent test, that naive drawdown-stops destroy value.
The verdict — H8 confirmed, and the trilogy closes
H8 is confirmed, and sharpened into a design rule. Hard, deterministic limits turn an aggressive, untradeable strategy into a viable one — drawdown more than halved, tail risk more than halved, Calmar and Sharpe up — at a real and expected cost in gross return, precisely the “stability and viability even where they reduce returns” the hypothesis claims. But the test refuses to bless all limits equally: the leverage cap earns its cost as a worst-case guarantee, the volatility/CVaR budget earns it twice over by also improving efficiency, and the drawdown kill-switch does not earn it at all. That is a concrete instruction for the proposal’s Risk Agent: build it from caps and volatility/CVaR budgets — inviolable bounds and forward-looking risk scaling — and treat reactive drawdown-stops with suspicion.
This closes the hypothesis trilogy, and the four regime/risk experiments now tell one coherent, evidence- based story. H5 — a discrete regime adds nothing beyond volatility for sizing. H2-calibration — but it sharpens risk probabilities. H6 — and the benefit of adaptivity concentrates at the transitions. H8 — while hard risk limits, especially volatility/CVaR budgets, are what make the whole thing viable. Detection and assessment at the turning points; forward-looking hard risk control throughout; no faith in sizing alpha or reactive stops. The proposal is stronger for having had its own hypotheses tested rather than assumed — including the ones that came back as nulls.
Limitations
- A bull-market sample understates the case. 2016–2026 was mostly rising, so the return the limits cost is at its most visible and the ruin they prevent never actually happened; in a sideways or bear decade the trade would look far more favourable. The −63% drawdown is a real 2022 figure, not a simulation, but the net verdict is conservative here.
- The kill-switch is one parameterisation. A −20% threshold and a halving; other thresholds behave differently, but the structural problem — selling after the fall — is general, and matches the independent multi-agent result.
- Constant desired leverage. The base is a fixed 2×; a signal-driven aggressive strategy would interact with the limits differently, though the stability conclusions should carry.
- Costs and financing are stylised. Flat 2 bps/turnover, and the cost of leverage itself is not charged — which would penalise the unconstrained 2× further, again making the limits look better than shown.
What I learned
The clarifying lesson is that hard limits have two distinct jobs, and it pays to know which one you are buying. A leverage cap buys a guarantee — it does not make you more efficient, it makes the worst case bounded and known, which is its own kind of value and the reason it must be inviolable rather than a soft preference. A volatility budget buys efficiency — it moves risk out of the periods that don’t pay for it. Conflating the two, or expecting a guarantee to also improve returns, is how risk limits get mis-set. And the drawdown kill-switch is the standing reminder that an intuitive risk control can be actively harmful: “cut after a loss” feels prudent and tests badly, twice now, on independent setups. Measuring viability honestly — not just return, and not just Sharpe — is what lets a risk framework be judged on what it is actually for.
References
- Grossman, S. J., & Vila, J.-L. (1992). Optimal Dynamic Trading with Leverage Constraints. Journal of Financial and Quantitative Analysis, 27(2).
- Almgren, R., & Chriss, N. (2001). Optimal Execution of Portfolio Transactions. Journal of Risk, 3(2).
- Moreira, A., & Muir, T. (2017). Volatility-Managed Portfolios. Journal of Finance, 72(4).
- López de Prado, M. (2018). Advances in Financial Machine Learning. Wiley.
Base: 2× leveraged long NDX, net 2 bps/turnover, out-of-sample 2016–2026. Hard limits: leverage cap 1.5×; volatility budget (target ≈ 17.5% annualised); drawdown kill-switch (halve exposure below −20% trailing drawdown). Results — unconstrained: CAGR 35.5%, vol 45%, maxDD −63%, CVaR₉₅ 6.8%, Sharpe 0.90, Calmar 0.56. Full hard-limited: CAGR 19.1%, vol 18.4%, maxDD −26%, CVaR₉₅ 2.8%, Sharpe 1.04, Sortino 1.36, Calmar 0.74. Leverage cap alone: Sharpe 0.90 (unchanged), maxDD −50%. Kill-switch alone: Sharpe 0.88 (down), maxDD −38%. Computed from equations/multi_daily.csv, verified in the sandbox.