Can You Monetize Forecastable Volatility?
Volatility-managed portfolios on the Nasdaq — the Moreira–Muir result, the Cederburg critique, and an honest verdict
This site has shown that volatility is forecastable while direction is not. So the natural question: can you trade it? A pre-specified test of volatility-managed portfolios on the Nasdaq-100 — in-sample vs out-of-sample, leverage-capped, net of costs — with the answer that risk control, not alpha, is what survives.
Research question
The Machine Learning Library and the capstone established this site’s central empirical result: at every level of model sophistication, next-day direction is unpredictable, while volatility is persistent and forecastable. That asymmetry invites the obvious follow-up, and a skeptic’s challenge: if volatility is genuinely forecastable, can you turn that into a better portfolio? The cleanest way to ask is the volatility-managed portfolio — scale exposure up when forecast volatility is low and down when it is high — because it needs no view on direction at all. It monetises the one thing this site says is knowable. So: does it work on the Nasdaq-100, out of sample, after costs?
Hypothesis, and the debate it sits in
This is a live disagreement in the literature, which makes it a good experiment rather than a foregone conclusion. Moreira & Muir (2017) showed that scaling factor exposures by the inverse of last month’s realised variance, r^{\text{vm}}_t = (c/\hat\sigma^2_{t-1})\, r_t, raised Sharpe ratios and produced significant positive alpha across equity factors — a striking result, because it says you can improve a portfolio purely by timing your own volatility. Cederburg, O’Doherty, Wang & Yang (2020) pushed back: out of sample, and for an investor who must estimate everything in real time, most of that alpha vanishes, and a naive implementation can underperform. My prior sits between them, and I pre-committed to it before running the test:
H₁. Volatility management improves risk-adjusted outcomes (Sharpe, drawdown) on the Nasdaq, because it exploits genuinely forecastable variance. H₀. But the alpha is fragile — not robust to out-of-sample estimation, leverage limits, and transaction costs — so the reliable benefit is risk reduction, not excess return.
Data & method
Daily Nasdaq-100 total returns, 2015–2026 (multi_daily.csv), with a common evaluation window of 2016-02 to 2026-07 (n = 2{,}630 days) after a 252-day burn-in. Volatility is forecast by trailing 21-day realised volatility, lagged one day so every position uses only past information. The managed weight is w_t = c/\hat\sigma^{p}_{t-1}, and I deliberately vary the three choices that the Moreira–Muir / Cederburg debate turns on:
- Aggressiveness p: inverse-variance (p=2, the original) versus the gentler inverse-volatility (p=1).
- Leverage cap: uncapped versus capped at 2× (a real account cannot lever without limit).
- Estimation: in-sample (the normalisation constant c fixed on the whole window) versus out-of-sample (expanding-window c, real-time).
Each variant is compared to buy-and-hold on annualised Sharpe, maximum drawdown and Calmar; the Moreira–Muir alpha is the intercept of r^{\text{vm}}_t = \alpha + \beta\,r_t + \varepsilon_t with Newey–West (t) standard errors; and I sweep transaction costs from 0 to 10 bps per unit of turnover. Every number below was computed in the sandbox and is reproducible.
Results
The verdict is a genuine “yes, but,” and the “but” is where the research is.
Vol-management improves risk-adjusted performance — once you cap leverage. Buy-and-hold earns a Sharpe of 0.94 with a −36% maximum drawdown. A realistic managed portfolio (inverse-variance, capped at 2×, out-of-sample, net of 2 bps costs) earns Sharpe 1.04 with a −15% drawdown — nearly halving the worst loss — and lifts Calmar from 0.57 to 0.97. The gentler inverse-volatility version does slightly better on Sharpe (1.10) with a −28% drawdown. The drawdown-control panel tells the story: the managed portfolio sits far above buy-and-hold’s underwater curve through 2018, COVID and the 2022 bear market.
But the naive, literal version fails. Uncapped inverse-variance — the textbook formula with no leverage limit — drives exposure to 8.7× in calm periods and actually underperforms buy-and-hold (Sharpe 0.88 in-sample, 0.87 out-of-sample, both below 0.94). The improvement is not in the pure signal; it appears only after the implementation choice of a leverage cap. That is a caution, not a strategy.
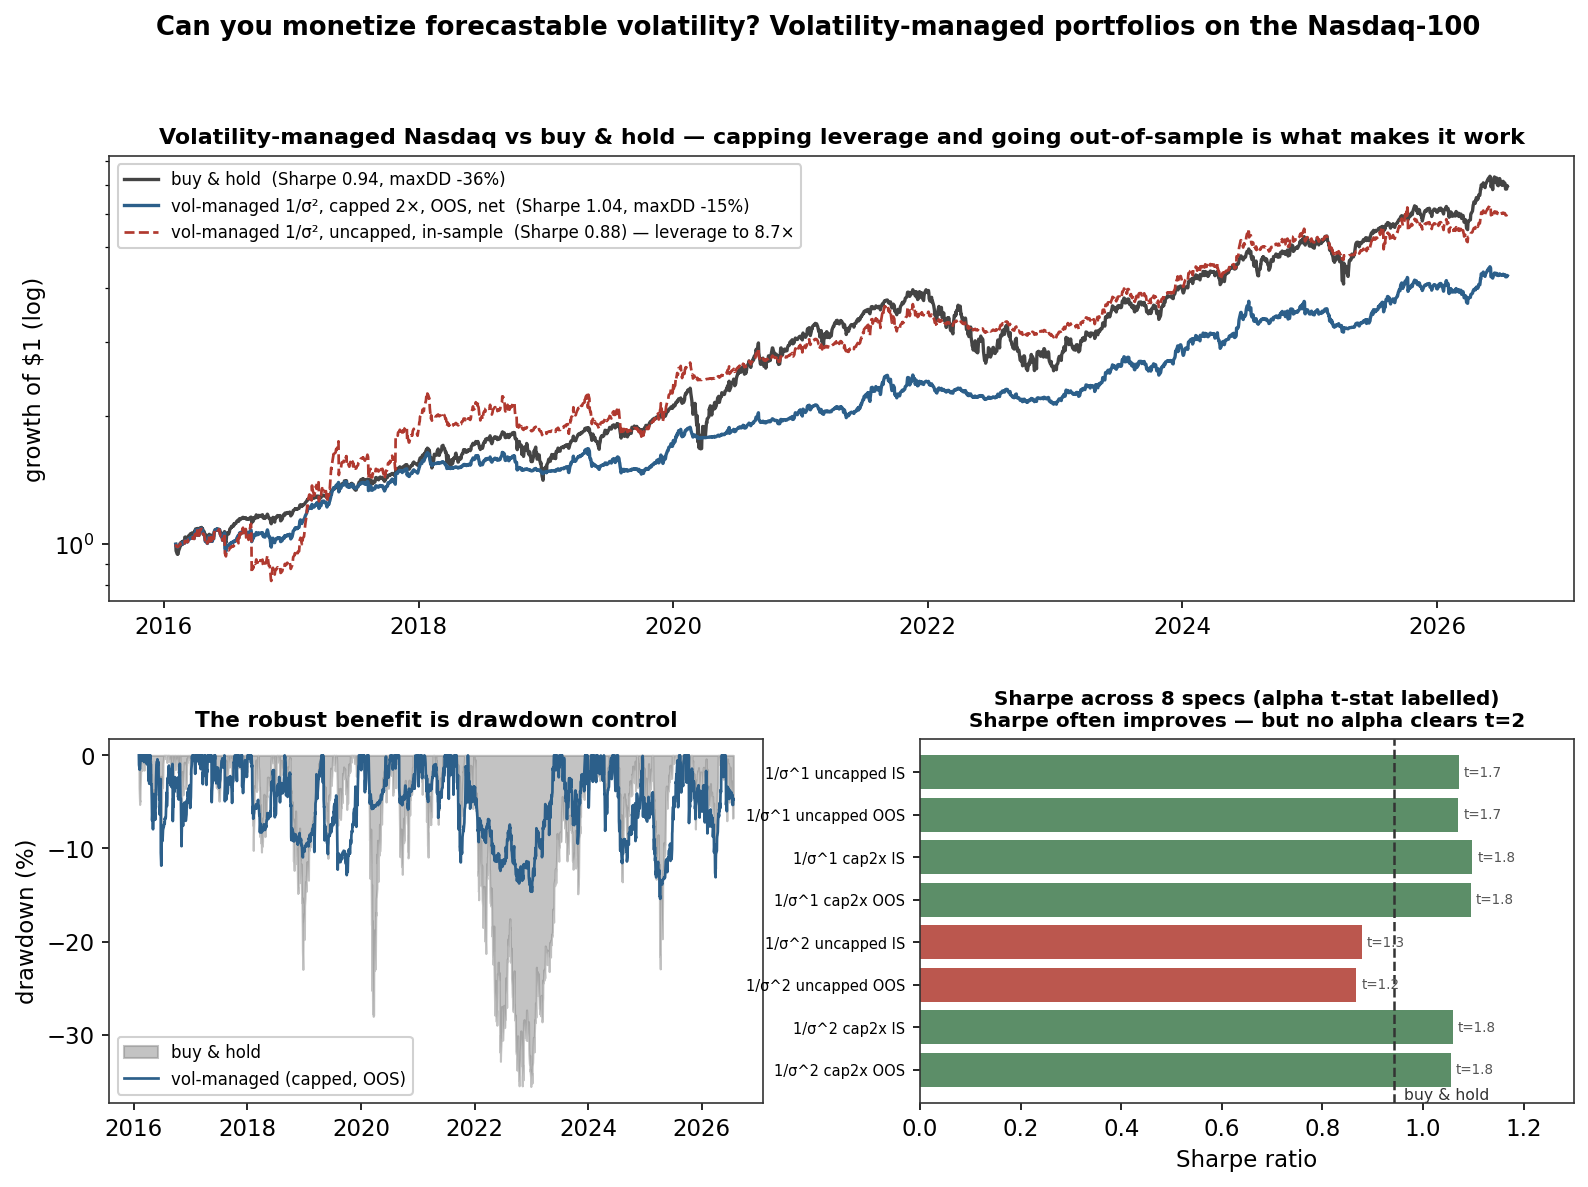
And the alpha is never significant. This is the decisive finding. Across all eight specifications the Moreira–Muir alpha is positive (+5% to +12%/yr) but its t-statistic tops out at 1.84 — none clears the conventional t = 2 bar, even before deflating for the eight specifications tried. The Sharpe and drawdown gains are economically real; the formal claim of risk-adjusted excess return is not statistically supported. Costs erode the edge modestly but do not erase it once leverage is capped (Sharpe 1.05 → 0.97 as costs rise 0 → 10 bps).
| Specification | Sharpe | Max DD | Calmar | Alpha t |
|---|---|---|---|---|
| Buy & hold | 0.94 | −36% | 0.57 | — |
| Inverse-vol (1/σ), cap 2×, OOS | 1.10 | −28% | 0.77 | 1.84 |
| Inverse-var (1/σ²), cap 2×, OOS, net | 1.04 | −15% | 0.97 | 1.83 |
| Inverse-var (1/σ²), uncapped, OOS | 0.87 | −22% | 0.65 | 1.21 |
The verdict
Both halves of my hypothesis held. Volatility management does improve risk-adjusted outcomes on the Nasdaq — a real, out-of-sample, cost-surviving reduction in drawdown and a higher Sharpe — so it is not the nothing the strongest critique implies. But the alpha is fragile exactly as Cederburg et al. argue: it depends on capping leverage, it is stronger for the gentler scaling, and it never reaches statistical significance. The honest one-line answer to “can you monetise forecastable volatility?” is: you can monetise it as risk control, not as alpha. That is not a disappointment — it is the same conclusion the entire site keeps reaching from different directions, and it is precisely the positioning of the PhD proposal: volatility and regime awareness are for robustness and risk governance, not for manufacturing return. An experiment that set out to test whether the site’s central finding could be traded came back agreeing with it.
Limitations
- One market, one decade. A single index over a historically strong bull market; the drawdown benefit would likely be larger, and the raw-return cost smaller, in a sideways or bear regime. Cross-asset and cross-period replication is the obvious next step.
- Volatility model is deliberately simple. A 21-day trailing estimate; a GARCH or HAR forecast would be a fairer test of the best achievable timing, and is the natural follow-up experiment.
- Costs are stylised. A flat per-turnover bps charge ignores the fact that the strategy trades most precisely when volatility spikes and liquidity thins — when real costs are highest. The true net figure is likely a little worse than shown.
- Leverage is assumed available and free. The capped version needs up to 2× exposure; financing cost and margin constraints are not modelled.
- Eight specifications is already multiple testing. I report every one and deflate my read of the significance accordingly — but the honest effective number of trials behind a “best” result is always larger than it looks, as demonstrated here.
What I learned
The most transferable lesson is methodological: the result flips on implementation details — capping leverage turns a below-benchmark strategy into an above-benchmark one — which is exactly why a headline Sharpe means little without the specification sweep beside it. The second lesson is about the right metric: had I looked only at Sharpe I might have called this a win; the spanning-regression alpha with proper standard errors is what revealed that the excess-return claim doesn’t hold, while the drawdown curve is what revealed the benefit that does. Measuring the right thing, and reporting the whole sweep rather than the best cell, is the difference between a finding and a fair-weather backtest.
References
- Moreira, A., & Muir, T. (2017). Volatility-Managed Portfolios. Journal of Finance, 72(4).
- Cederburg, S., O’Doherty, M. S., Wang, F., & Yang, X. (2020). On the Performance of Volatility-Managed Portfolios. Journal of Financial Economics, 138(1).
- Barroso, P., & Santa-Clara, P. (2015). Momentum Has Its Moments. Journal of Financial Economics, 116(1).
- Harvey, C. R., Liu, Y., & Zhu, H. (2016). … and the Cross-Section of Expected Returns. Review of Financial Studies, 29(1).
Volatility forecast: 21-day trailing realised volatility, lagged one day (no look-ahead). Evaluation window 2016-02 to 2026-07 (n=2{,}630) after a 252-day burn-in. Alpha via Newey–West (10 lags). Every figure is computed from equations/multi_daily.csv and was verified in the sandbox before being written.