CAGR
The smooth annual growth rate — what your money actually compounded at
“Total return over ten years” is a useless number on its own — was that 10% a year, or one lucky spike? CAGR turns any start-to-end growth into a single, comparable rate: the constant annual return that, compounded smoothly, would have carried you from here to there. It is the honest headline for a track record — and it is exactly the geometric mean growth rate that Mean Return warned sits below the arithmetic average.
The equation
\text{CAGR} = \left(\frac{V_{\text{end}}}{V_{\text{begin}}}\right)^{1/T} - 1
where T is the number of years. From prices it is just the end-to-start ratio raised to one-over-the-years, minus one; from a return series it is the geometric mean of the annual growth factors.
What each symbol means
| Symbol | Meaning |
|---|---|
| \text{CAGR} | compound annual growth rate — the constant yearly rate |
| V_{\text{begin}},\ V_{\text{end}} | the starting and ending values |
| T | the number of years (the horizon) |
| V_{\text{end}}/V_{\text{begin}} | the total growth multiple over the whole period |
CAGR is the geometric mean: (1+\text{CAGR})^{T} = V_{\text{end}}/V_{\text{begin}}, so raising the total multiple to 1/T recovers the per-year rate.
Plain-English explanation
Suppose $10,000 became $20,000 over six years. The naive “average” — 100% total ÷ 6 = 16.7% a year — is wrong, because returns compound: 16.7% every year would have made far more than double. The right answer is the CAGR: the rate r with (1+r)^6 = 2, which is 2^{1/6} - 1 = 12.2\%. That is the constant annual rate that actually doubles money in six years (and, by the rule of 72, 72/12 \approx 6 years — the two agree).
CAGR smooths the whole path into one number. It is the fairest single summary of a long track record, because it ignores when the gains arrived and reports only what compounded.
Why it matters in markets
CAGR is how growth is quoted and compared — funds, indices, companies, GDP — because it is horizon-adjusted and compound-correct. Two properties are worth holding onto.
First, it is the geometric mean, so it is what determines terminal wealth, and it always sits below the arithmetic mean annual return by roughly half the variance — the volatility drag from Mean Return. A 21% average year, with big swings, can compound to only 18%.
Second — the warning — CAGR is completely path-blind: it depends only on the endpoints. Two investments with identical CAGR can have wildly different volatility and drawdowns; a smooth 12%/yr and a terrifying ride that happens to end in the same place share a CAGR but nothing else. That is why CAGR is never quoted alone — it rides with Sharpe, volatility, and maximum drawdown.
A simple worked example
An investment grows from $10,000 to $20,000 over 6 years — it doubled:
\text{CAGR} = \left(\frac{20{,}000}{10{,}000}\right)^{1/6} - 1 = 2^{1/6} - 1 = 12.2\%.
Not the naive 100\%/6 = 16.7\%: because 16.7% compounded for six years would turn $10,000 into over $25,000, not $20,000. Compounding is exactly why the honest number is lower.
Python implementation
import pandas as pd

px = pd.read_csv("../multi_daily.csv", index_col="Date", parse_dates=True)["NDX"]

years = (px.index[-1] - px.index[0]).days / 365.25       # 11.55 years
cagr  = (px.iloc[-1] / px.iloc[0]) ** (1 / years) - 1
print(round(cagr * 100, 2))                               # -> 18.16   (%)

# from a return series instead of prices: geometric mean of the growth factors
r = px.pct_change().dropna()
cagr = (1 + r).prod() ** (252 / len(r)) - 1               # 252 trading days per year
print(round(cagr * 100, 2))                               # -> ~18.2
Two routes, one answer. The trap is T: use actual years (calendar days / 365.25) for a price series, or the trading-day count for a daily return series — mixing them mis-scales the rate.
Manual / Excel calculation
| Task | Formula |
|---|---|
| CAGR from values | =(End/Begin)^(1/years) - 1 |
| CAGR from prices with dates | =(End/Begin)^(365/(EndDate-BeginDate)) - 1 |
| Built-in | =RRI(years, Begin, End) |
RRI(n, pv, fv) returns exactly the CAGR — Excel’s purpose-built function for it.
Financial-market example — Nasdaq 100
Over its full 2015–2026 history, NDX grew one dollar into about $6.90 — a 587% total return — which is a CAGR of 18.2% a year. The figure shows why the single number is so useful: the smooth 18.2% curve passes right through the bumpy actual path, meeting it at both ends.
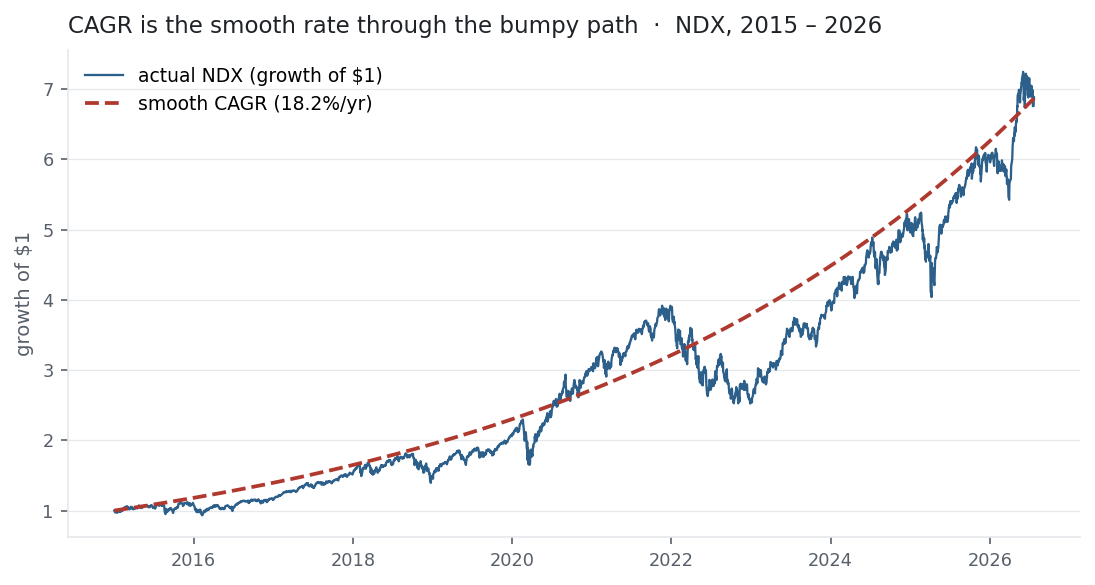
The volatility drag is right there in the numbers. NDX’s ten calendar-year returns (2016–2025) ranged from −33% to +54% and averaged 21.4% — but that arithmetic average is not what an investor earned. Compounded, those same years delivered a CAGR of only 18.6%. The 2.9-point gap is almost exactly half the variance of the annual returns — the volatility drag from Mean Return, now at annual scale.
Across the basket the CAGRs tell the real growth story — NVDA 69%, AAPL 25%, MSFT 22%, NDX 18%, PEP 6% — but recall from maximum drawdown that NVDA’s 69% came with a 66% peak-to-trough fall. Same kind of number, very different ride: the rate you compound at is only half the story.
Same multi_daily.csv as the previous entries (yfinance, adjusted closes). Code blocks are illustrative — every figure was computed and checked against that file.
Common mistakes
- Dividing total return by years. 100% over 6 years is not 16.7%/yr — compounding makes the true CAGR 12.2%. The naive average always overstates.
- Confusing CAGR with the arithmetic mean. CAGR (geometric) is always ≤ the arithmetic mean annual return, by ≈\tfrac{1}{2}\sigma^2. Quoting the arithmetic average as “annual return” flatters a volatile record.
- Thinking CAGR measures risk. It is path-blind — endpoints only. Two assets with the same CAGR can have completely different volatility and drawdown.
- Cherry-picking the endpoints. CAGR is exquisitely sensitive to the start and end dates; beginning at a trough or ending at a peak inflates it. Always state the window.
- Using it over too short a horizon. A one-year CAGR is just the total return; the compounding story needs several years to mean anything.
- Mixing day-count conventions. Calendar years versus trading days for T changes the answer — be consistent.