Time-Series Cross-Validation
From one honest backtest to a distribution of them — purged K-fold and combinatorial purged CV
The walk-forward page gave an honest out-of-sample estimate — but a single one. Test on one sequence of future blocks and you get one number, and you cannot tell whether an AUC of 0.53 (or a Sharpe of 1.2) is a durable edge or a lucky accident of where the split lines happened to fall. Time-series cross-validation is the broader family of schemes that fixes this: how to squeeze multiple leakage-free out-of-sample estimates from one finite history, culminating in combinatorial purged cross-validation, which turns a lone backtest into a whole distribution of them. It is the difference between “my strategy scored 0.53” and “my strategy scores 0.53 on average, but ranges from below chance to 0.57 depending on the period — how much do I trust it?”
1. What problem does it solve?
Getting robust, non-leaking out-of-sample estimates from limited temporal data. Walk-forward tests each point once and yields a single path, so its estimate is high-variance and easy to over-read. This family generalises it in two directions: schemes that test every observation without leakage (purged K-fold), and schemes that generate many backtest paths from the same data (combinatorial purged CV), producing a distribution of performance from which you can judge robustness and even estimate the probability that a good-looking backtest is overfit.
2. What assumptions does it make?
Everything walk-forward assumes — data ordered in time, not exchangeable, no future informing the past — plus two more. First, that each observation has a known label span, so you can identify and purge the overlaps that leak across a train/test boundary. Second, that the series is stationary enough that different time blocks are comparable, since combining test blocks into synthetic paths only makes sense if a model trained on one period is meaningfully evaluated on another.
3. What data does it need?
Temporally ordered data with defined label horizons (so overlaps can be purged), and enough history to form several groups each large enough to train and test on. It is most valuable exactly when data is scarce — you want to reuse every observation — and leakage-prone, with overlapping or autocorrelated labels. That combination is the norm in finance, which is why these schemes originated there.
4. How does it work?
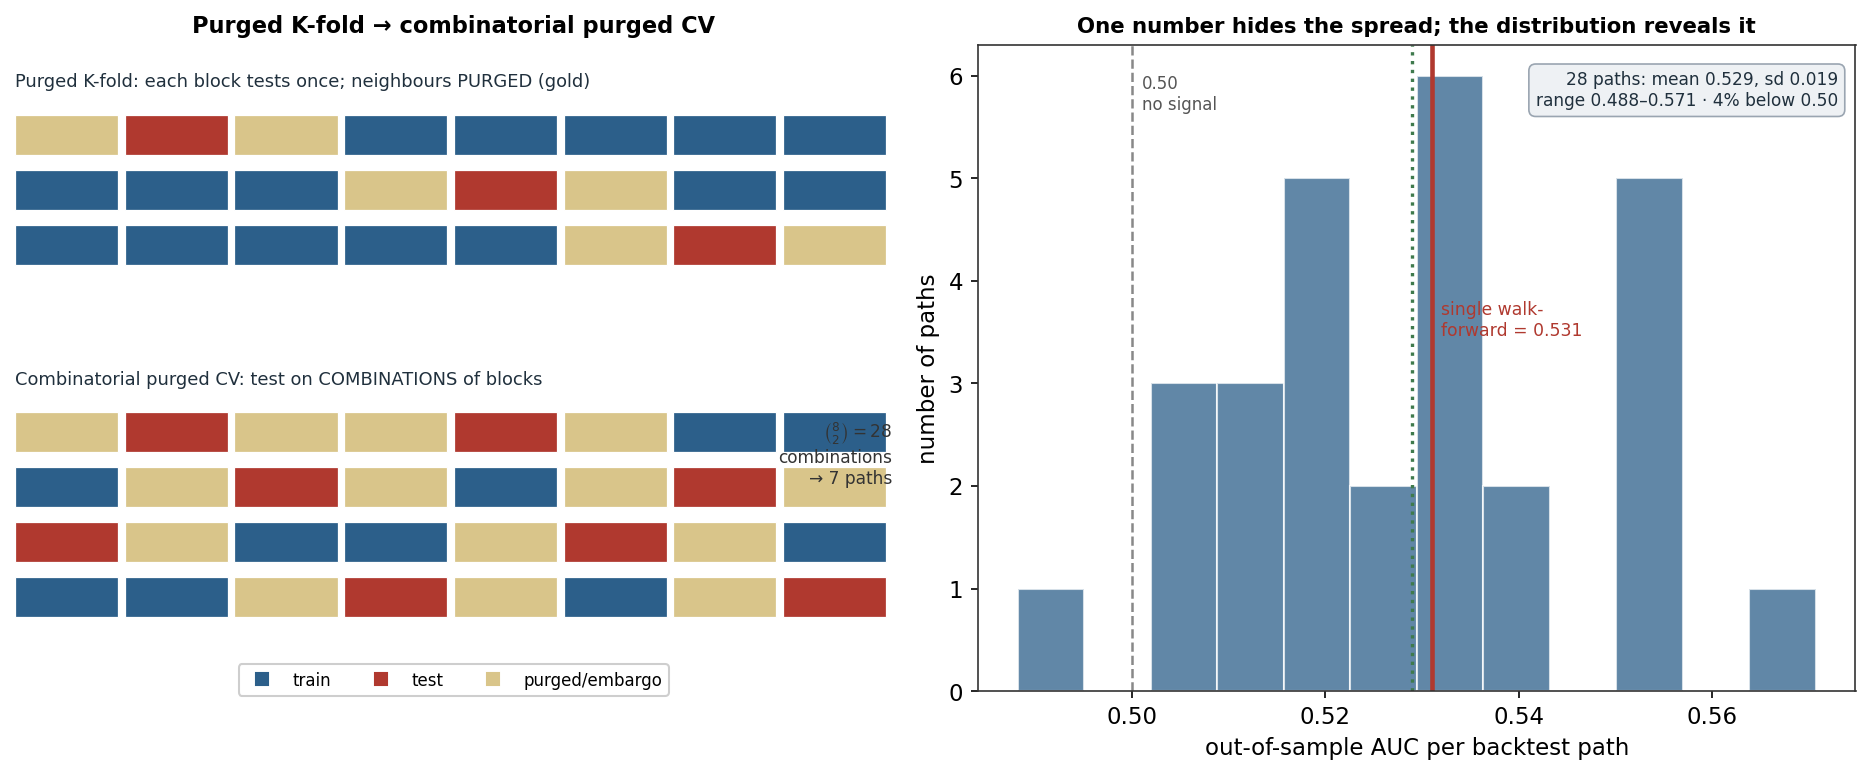
Three schemes, in increasing sophistication (the left panel shows the last two):
- Walk-forward (expanding or rolling) — sequential train-then-test. One path, covered previously.
- Purged K-fold — split into K folds and let each take a turn as the test fold, but purge any training observation whose label overlaps the test fold and embargo a short gap after it. This tests every point exactly once with no leakage — better data use than walk-forward, though still a single path.
- Combinatorial purged cross-validation (CPCV) — split the history into N groups and test on every combination of k groups (each combination purged). The \binom{N}{k} combinations recombine into \varphi = k\binom{N}{k}/N distinct backtest paths, so instead of one performance number you get a distribution — and from it the probability of backtest overfitting and honest confidence intervals.
The demonstration makes the value tangible. On a Nasdaq volatility task, a single walk-forward reports an AUC of 0.531 — one number. Run CPCV with N=8 groups and k=2 test groups — 28 purged combinations forming 7 paths — and that number becomes a distribution: mean 0.529, standard deviation 0.019, ranging from 0.488 (below chance) to 0.571, with 4% of paths worse than a coin flip. The single 0.531 was simply one draw from this spread. The volatility edge is real but modest and fragile across periods — a fact the point estimate conceals entirely and the distribution makes obvious. For a real strategy you report the whole distribution and ask whether the edge survives across paths, not whether one backtest happened to look good.
5. What are its strengths?
- Every point tested, no leakage. Purging and embargo let you use all the data without the temporal contamination that inflates k-fold.
- A distribution, not a point. CPCV’s many paths reveal the variance of performance — how much a single backtest could have been luck.
- Estimates overfitting risk. From the path distribution you can compute the probability of backtest overfitting, a real defence against fooling yourself.
- The finance-grade standard. It is the most rigorous honest-evaluation toolkit available for strategy research.
6. What are its weaknesses?
- Computationally heavy. CPCV fits a model per combination — many more than a single walk-forward.
- Needs label spans. You must know each label’s horizon to purge correctly; getting it wrong reintroduces leakage.
- Assumes comparable blocks. Recombining periods into paths presumes enough stationarity; a strong regime break undermines it.
- Harder to implement. Purge/embargo bookkeeping is fiddly and easy to get subtly wrong.
- Measures, doesn’t cure. It quantifies uncertainty and overfitting risk but cannot create signal — and repeated strategy trials can still overfit, as the next page discusses.
7. How could it apply to markets?
This is how serious quant evaluation is actually done: you do not report one backtest Sharpe, you report the distribution of Sharpes across purged combinatorial paths and the probability that your best-looking configuration is a fluke. The demonstration is a clean example — a modest, genuine volatility signal whose single-path AUC of 0.531 hides a spread from below chance to 0.571. Seeing that spread changes the decision: an edge that is positive on average but dips below 0.50 on some periods is far more fragile than the point estimate suggests. For a MarketLens signal, when you tune features or a model, evaluate with purged cross-validation and study the whole distribution before trusting it — the mean tells you the edge, the spread tells you whether to believe it.
8. What does the Python code look like?
from itertools import combinations
import numpy as np

def combinatorial_purged_cv(X, y, model, N=8, k=2, embargo=10):
    groups = np.array_split(np.arange(len(y)), N)
    aucs = []
    for test_groups in combinations(range(N), k):
        test = np.concatenate([groups[g] for g in test_groups])
        purged = set()
        for g in test_groups:                       # purge + embargo around EACH test block
            lo, hi = groups[g][0], groups[g][-1]
            purged.update(range(max(0, lo - embargo), min(len(y), hi + embargo + 1)))
        train = np.array([i for i in range(len(y)) if i not in set(test) and i not in purged])
        model.fit(X[train], y[train])
        aucs.append(roc_auc_score(y[test], model.predict_proba(X[test])[:, 1]))
    return np.array(aucs)      # a DISTRIBUTION — report mean, spread, and % below chance
TimeSeriesSplit is the baseline single-path scheme; libraries like mlfinlab implement purged K-fold and CPCV directly. The essential ideas are purging the overlaps and looking at the whole distribution of scores, not just their mean.
9. How would I explain it to a supervisor?
“Walk-forward gives one honest backtest, but one number can be a lucky split. Time-series cross-validation is the family that fixes that. Purged K-fold tests every point once but removes training rows whose labels overlap the test fold and embargoes a gap, so there’s no leakage. Combinatorial purged CV goes further: it tests on every combination of time blocks and recombines them into many backtest paths, giving you a distribution of performance instead of a point. On a Nasdaq volatility task the single walk-forward AUC was 0.531, but the distribution across 28 purged combinations ran from 0.49 — below chance — to 0.57, with a 4% chance of a losing path. That spread is the real information: it tells you the edge is modest and fragile, which a single 0.531 hides. It’s the finance-grade way to see whether a backtest is robust or just lucky — and it measures overfitting risk without being able to cure it.”
Nasdaq-100 volatility task (next-day above-median absolute return, overlapping rolling features) from the same multi_daily.csv as the earlier entries. Combinatorial purged CV with N=8 groups, k=2 test groups (28 combinations, 7 paths), 10-day embargo, random-forest classifier; compared with a single TimeSeriesSplit walk-forward. Distribution statistics and the path count \varphi = k\binom{N}{k}/N were computed and checked.