How Far Ahead Is Volatility Forecastable?
HAR, GARCH and naive persistence on the Nasdaq — the half-life of a volatility shock, and why forecast skill fades by a quarter
This site keeps repeating that volatility is forecastable. This experiment asks the precise follow-up: for how long, and with which model? A horizon analysis of HAR, GARCH(1,1), EWMA and persistence on the Nasdaq-100 — with the answer that a volatility shock half-lives in about a month, and that beating naive persistence matters more the further ahead you look.
Research question
Across the libraries and the capstone, one finding recurs: volatility is forecastable where direction is not. But “forecastable” is a slogan until you put a number on it. This experiment asks the precise questions a risk system actually needs answered: how many days ahead does a volatility forecast carry real information, how fast does that skill decay, and which model — a simple parametric GARCH, the realized-volatility workhorse HAR, an exponential-weighted average, or naive persistence — does it best? The answer sets the horizon over which the proposal’s Regime Agent can genuinely see.
Hypothesis
Volatility is persistent but mean-reverting, so I expected three things, pre-committed before running the test. First, forecast skill is real at short horizons and decays toward the unconditional level as the horizon grows. Second, because persistence (“tomorrow’s vol equals today’s”) ignores mean reversion, a proper model should beat it by more the further ahead you forecast. Third, the honest absolute skill would look deceptively low against daily squared returns — a notoriously noisy proxy for true variance (Andersen & Bollerslev, 1998) — so the proxy-robust QLIKE loss and comparisons between models would tell the real story, not raw R² against the proxy.
Data & method
Daily Nasdaq-100 returns, 2015–2026 (multi_daily.csv), split 65/35 into a training period (2015-01 → 2022-06) and an out-of-sample test period (2022-07 → 2026-07). The daily variance proxy is the squared return v_t = r_t^2, and the forecasting target at horizon h is the average daily variance over the next h days, \bar v_{t+1:t+h}, evaluated for h \in \{1, 5, 10, 22, 44, 66, 132\} — one day to roughly six months. Four forecasters, each using only information available at t:
- Persistence (RW) — trailing 22-day mean variance, held flat across horizons; the naive benchmark.
- EWMA — RiskMetrics exponential weighting (\lambda = 0.94).
- GARCH(1,1) — \sigma^2_{t+1} = \omega + \alpha r_t^2 + \beta\sigma^2_t, fit on the training returns; multi-step forecasts computed analytically, \mathbb{E}[\sigma^2_{t+k}] = \bar\sigma^2 + (\alpha+\beta)^{k-1}(\sigma^2_{t+1}-\bar\sigma^2), averaged over the horizon.
- HAR (Corsi, 2009) — regress the target on daily, weekly (5-day) and monthly (22-day) realized-variance components, \bar v_{t+1:t+h} = \beta_0 + \beta_d RV^{(d)}_t + \beta_w RV^{(w)}_t + \beta_m RV^{(m)}_t, fit directly per horizon on the training set.
Skill is measured three ways, deliberately: out-of-sample R^2 against naive persistence (does the model add value over “vol stays put”?), the proxy-robust QLIKE loss \tfrac1n\sum(\log\hat\sigma^2 + v/\hat\sigma^2) (Patton, 2011; lower is better), and the correlation between forecast and realized variance. Every figure was computed in the sandbox.
Results
A volatility shock half-lives in about a month. The fitted GARCH has \alpha = 0.17, \beta = 0.80, so persistence \alpha+\beta = 0.970 and an unconditional volatility of 22.6%. That persistence implies a shock half-life of \ln(0.5)/\ln(0.970) \approx 23 trading days — one month. The term-structure panel makes it concrete: after a variance spike to 3× normal, the forecast decays from ~39% annualized back toward 23% with that one-month half-life; a calm spell reverts up just as smoothly. This single number is the cleanest answer to “how far ahead”: volatility carries meaningful memory over about a month, and is largely back to its long-run average within a quarter.
A real model beats persistence by more the further ahead you look. At a one-day horizon, “tomorrow’s vol equals today’s” is hard to improve on — HAR and GARCH essentially tie it (R^2 vs persistence near zero). But persistence ignores mean reversion, so it degrades badly with horizon, and the value of a proper model grows: HAR’s out-of-sample R^2 over persistence climbs from +0.07 at ten days to +0.50 at 44 days to +0.79 at six months (left panel). Forecasting a month or a quarter of volatility is where modelling mean reversion earns its keep.
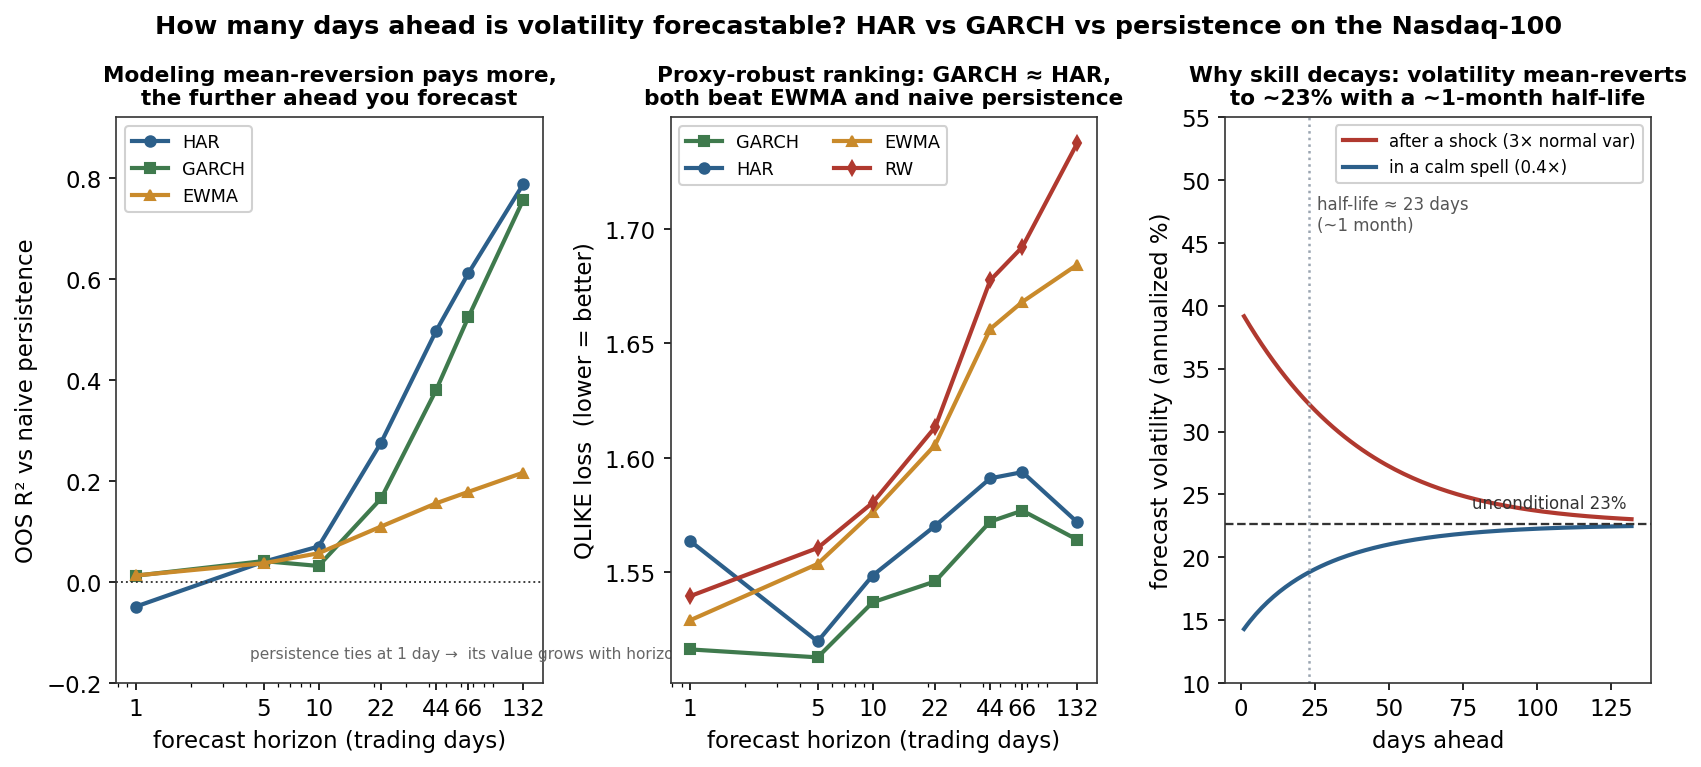
By the proxy-robust metric, GARCH edges HAR — and both dominate the naive benchmarks. On QLIKE, GARCH has the lowest loss at every horizon, HAR is a close second, and both beat EWMA and persistence throughout; persistence is worst and deteriorates fastest as the horizon grows (centre panel). That GARCH matches or beats HAR is itself worth noting: the realized-volatility literature usually finds HAR superior, but that edge comes from intraday realized variance — with only daily data, GARCH’s parametric mean-reversion is fully competitive. Forecast–realized correlation peaks around 0.30 at one to four weeks and fades to ~0.09 by six months, tracing the same decay.
| Horizon | HAR R² vs persistence | GARCH QLIKE (best) | Forecast–realized corr |
|---|---|---|---|
| 1 day | −0.05 (ties) | 1.52 | 0.19 |
| 10 days | +0.07 | 1.54 | 0.30 |
| 22 days (≈1 mo) | +0.28 | 1.55 | 0.31 |
| 66 days (≈1 qtr) | +0.61 | 1.58 | 0.19 |
| 132 days (≈2 qtr) | +0.79 | 1.56 | 0.09 |
The verdict
All three predictions held. Volatility on the Nasdaq is genuinely forecastable, but the honest, quantified statement is narrower than the slogan: a volatility shock has a one-month half-life, forecast skill is strongest over one to four weeks, and it has largely reverted to the unconditional 22.6% within a quarter. The right model is a mean-reverting one — GARCH or HAR, essentially tied on daily data — and its advantage over naive persistence is not at short horizons (where persistence is fine) but at monthly- to-quarterly ones (where persistence, blind to mean reversion, falls apart). For the proposal this is a concrete design input: the Regime Agent’s volatility foresight is real but short — a horizon of about a month — which is precisely why the architecture pairs a slow regime label with a fast online change-point detector, and why risk controls must be reactive rather than relying on long-range volatility prediction.
Limitations
- The daily proxy is noisy. A single day’s squared return is a high-variance estimate of that day’s variance, which is why absolute R^2 against it is near zero even for good models (Andersen & Bollerslev’s “answering the skeptics” point) — the true forecast skill is masked by proxy noise. Intraday realized variance from 5-minute returns would raise every number here; the persistence-relative and QLIKE comparisons are the proxy-robust reads I rely on instead.
- One asset, one split. A single index and a single 65/35 train/test cut; a rolling-origin evaluation and cross-asset replication would sharpen the confidence intervals (not computed here).
- GARCH parameters are frozen on the training set. Re-estimating on an expanding window would let the model adapt to a shifting volatility regime and likely help at longer horizons.
- No jumps or leverage term. A GJR/EGARCH (asymmetric) or a HAR with a jump component would fit the leverage effect this site has documented and is a natural extension.
- Simple HAR. Log-RV or a HARQ (measurement-error-corrected) specification is the modern standard and would be the fairer test of HAR’s ceiling.
What I learned
The transferable lesson is about measurement, not models: the same experiment looks like “volatility is barely forecastable” under raw R^2 against the noisy proxy and like “volatility is clearly forecastable” under QLIKE and against persistence — so choosing a proxy-robust loss is not a technicality, it is the difference between the right and wrong conclusion. The second lesson is that the benchmark must scale with the question: persistence is a strong benchmark at one day and a straw man at one quarter, so a model’s value can only be read horizon by horizon. The half-life of a volatility shock — about a month — is the kind of single, interpretable number that a slogan like “volatility clusters” was always standing in for.
References
- Corsi, F. (2009). A Simple Approximate Long-Memory Model of Realized Volatility. Journal of Financial Econometrics, 7(2).
- Andersen, T. G., & Bollerslev, T. (1998). Answering the Skeptics: Yes, Standard Volatility Models Do Provide Accurate Forecasts. International Economic Review, 39(4).
- Bollerslev, T. (1986). Generalized Autoregressive Conditional Heteroskedasticity. Journal of Econometrics, 31(3).
- Patton, A. J. (2011). Volatility Forecast Comparison Using Imperfect Volatility Proxies. Journal of Econometrics, 160(1).
GARCH(1,1) fit with arch on training returns (\alpha=0.173, \beta=0.797, persistence 0.970, unconditional vol 22.6%); multi-step forecasts analytic. HAR fit by OLS per horizon on the training set. Target: average daily variance over the next h days; proxy v_t=r_t^2. Out-of-sample window 2022-07 → 2026-07. QLIKE per Patton (2011). All figures computed from equations/multi_daily.csv and verified in the sandbox.