Maximum Drawdown
The deepest peak-to-trough loss — the risk you have to survive, not just measure
The Sharpe and Sortino ratios measure reward per unit of risk — but they average risk away, and say nothing about the single worst moment. Maximum drawdown does. It is the largest peak-to-trough fall in an equity curve: the number that decides whether you could actually hold a strategy, or would have been stopped out, margin-called, or simply unable to sleep. It is the risk you have to survive.
The equation
Drawdown at time t is the decline from the running peak (the high-water mark); maximum drawdown is the worst one over the period:
\text{DD}_t = \frac{V_t}{\max_{s \le t} V_s} - 1, \qquad \text{MDD} = \min_{t}\, \text{DD}_t
where V_t is the cumulative value — the equity curve. Every \text{DD}_t \le 0; the MDD is the most negative of them.
What each symbol means
| Symbol | Meaning |
|---|---|
| V_t | the equity-curve value at time t (cumulative return, or portfolio value) |
| \max_{s \le t} V_s | the running peak up to t — the high-water mark |
| \text{DD}_t | drawdown at t: how far below the peak you are (0 at a new high, else negative) |
| \text{MDD} | maximum drawdown — the single deepest \text{DD}_t over the period |
MDD depends on the whole path, not the endpoints: an asset can finish up and still have put you through a brutal decline on the way.
Plain-English explanation
Track the highest value your portfolio has ever reached — the high-water mark. At any moment, the drawdown is how far below that high you currently sit: 0% when you’re at a new peak, negative when you’re underwater. The maximum drawdown is the worst that figure ever got — the biggest fall from a top to a later bottom.
It answers the question the ratios can’t: what is the most I would have lost holding this? A strategy with a wonderful average Sharpe is worthless if getting there meant sitting through a 60% loss you’d never actually have tolerated.
Why it matters in markets
Maximum drawdown is the survival constraint. Two properties make it the risk number practitioners lose sleep over: it is path-dependent — it captures the sequence of losses, not their average or their endpoint — and it maps straight onto real-world ruin, because leverage limits, margin calls, redemptions, and stop-losses all trigger on drawdown, not volatility. It also drives behaviour: the deeper the hole, the more likely an investor abandons a sound strategy at the exact bottom.
The related Calmar ratio, annualised return /\;|\text{MDD}|, turns it into a risk-adjusted measure alongside Sharpe and Sortino — reward per unit of worst-case pain. And recovery matters as much as depth: a −50% drawdown needs a +100% gain just to break even, so deep drawdowns cost time as well as money.
A simple worked example
Take an equity path V = [100,\ 110,\ 105,\ 120,\ 90,\ 100]. The running peak is [100,\ 110,\ 110,\ 120,\ 120,\ 120], so the drawdowns are [0\%,\ 0\%,\ -4.5\%,\ 0\%,\ -25\%,\ -16.7\%]. The worst is at V = 90, down from the peak of 120:
\text{MDD} = \frac{90}{120} - 1 = -25\%.
Notice the path ends at 100 — above where it started, a positive total return — yet it endured a 25% drawdown along the way. The final number never shows the pain in the middle.
Python implementation
import pandas as pd

px = pd.read_csv("../multi_daily.csv", index_col="Date", parse_dates=True)["NDX"]

peak = px.cummax()               # running high-water mark
dd   = px / peak - 1.0           # drawdown series (0 at highs, negative below)
mdd  = dd.min()                  # maximum drawdown

trough    = dd.idxmin()          # date of the worst point
peak_date = px.loc[:trough].idxmax()   # the peak it fell from

print(round(mdd * 100, 1))                      # -> -35.6   (%)
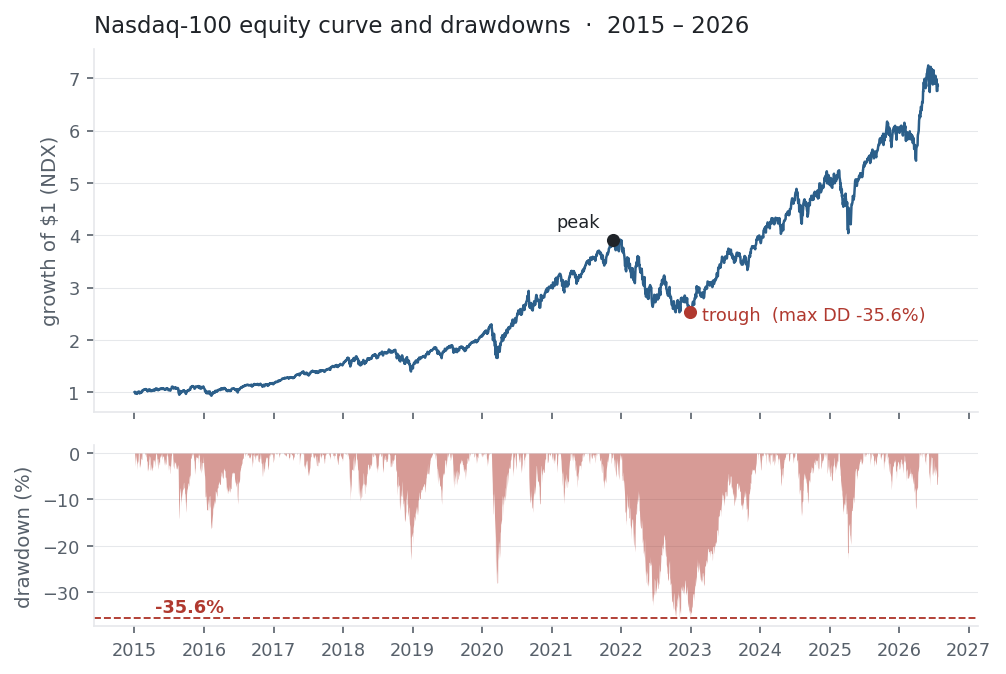
print(peak_date.date(), "->", trough.date())    # 2021-11-19 -> 2022-12-28
The whole calculation is px / px.cummax() - 1; everything else is just locating the dates. It works on any equity curve — a price series, or (1 + returns).cumprod() for a strategy.
Manual / Excel calculation
Build the running peak, then the drawdown, then take the minimum. With values in A2:A252:
| Task | Formula |
|---|---|
| Running peak (B2) | =MAX(A$2:A2) — fill down |
| Drawdown (C2) | =A2/B2 - 1 — fill down |
| Maximum drawdown | =MIN(C2:C252) |
The A$2:A2 anchor makes column B a running maximum that grows as you drag it down.
Financial-market example — Nasdaq 100
Over the full 2015–2026 history — a longer window than the ratios used, because a drawdown needs a real down-cycle to show itself — NDX’s worst drawdown was −35.6%: from the peak on 19 Nov 2021 to the trough on 28 Dec 2022. That was 404 days of decline, then another 352 to reclaim the old high (recovered Dec 2023) — nearly two years underwater for a −36% fall. Within the recent one-year window the ratios used, the worst drawdown was only −12%: an up-year hides its drawdowns.
Across the basket, drawdown separates the survivable from the stomach-churning:
| Ticker | max drawdown | CAGR | Calmar |
|---|---|---|---|
| NVDA | −66.3% | 69.1% | 1.04 |
| AAPL | −38.5% | 25.2% | 0.65 |
| MSFT | −37.2% | 21.9% | 0.59 |
| NDX | −35.6% | 18.2% | 0.51 |
| PEP | −30.3% | 6.3% | 0.21 |
NVDA compounded at a phenomenal 69% a year — but only for an investor who could hold through a two-thirds loss. Its Calmar (1.04) is the highest, so the return did justify the pain; the drawdown is simply the reason most people would have sold at the bottom and never seen the recovery. PEP is the mirror image — the shallowest drawdown, but so little return that its Calmar is the worst. The diversified index sits between them, with a smaller drawdown than any single tech name. Maximum drawdown is the number that decides whether a return is one you could actually have lived through to earn.
Same multi_daily.csv as the previous entries (yfinance, adjusted closes). Code blocks are illustrative — every figure was computed and checked against that file.
Common mistakes
- Judging by endpoints. A strategy up 200% can have suffered a 60% drawdown mid-way; only the path reveals it.
- Confusing depth with recovery. A −50% drawdown needs +100% to break even (−36% needs +55%); deep holes cost years, not just percent.
- Comparing drawdowns over different windows. Longer histories contain deeper drawdowns — MDD isn’t comparable unless the periods match.
- Treating a small backtested drawdown as a ceiling. The worst drawdown is almost always still ahead of you; in-sample MDD understates live risk.
- Ignoring drawdown because the Sharpe is high. Averaged risk measures miss the single loss that ends the game — always read MDD alongside them.
- Using only daily closes. Intraday drawdowns can be deeper than close-to-close; know which your number reflects.