Win Rate, Profit Factor & Expectancy
The trading-system report card — and why a high win rate can still lose money
A trading system produces a stream of trades, and three numbers summarise whether it is any good. The seductive one is the win rate — the fraction of trades that make money — but on its own it is nearly useless, because it ignores how big the wins and losses are. Profit factor and, above all, expectancy fix that. Expectancy is the average profit per trade — the real edge, and exactly the quantity Kelly turns into a bet size.
The equation
\text{Win rate} = \frac{\text{wins}}{\text{total trades}} \qquad \text{Profit factor} = \frac{\text{gross profit}}{\text{gross loss}}
\text{Expectancy} = p\,W - (1-p)\,L
Win rate is the fraction of profitable trades; profit factor is total money won over total money lost; expectancy is the average P&L per trade — the win rate p combined with the average win W and average loss L.
What each symbol means
| Symbol | Meaning |
|---|---|
| p | win rate — the fraction of trades that are profitable |
| W | average win (size of a winning trade) |
| L | average loss (size of a losing trade, as a positive number) |
| R = W/L | reward/risk ratio — average win over average loss |
| gross profit | the summed P&L of all winning trades |
| gross loss | the absolute summed P&L of all losing trades |
Profit factor > 1 and expectancy > 0 both mean “profitable” — the aggregate and the per-trade views of the same fact.
Plain-English explanation
Three questions about a system:
- Win rate — how often do I win? 60% means 6 trades in 10 are green. Intuitive, and the number beginners fixate on.
- Profit factor — for every dollar I lose, how many do I make? A profit factor of 1.5 means $1.50 won per $1 lost. Above 1 is profitable; 2 or more is strong.
- Expectancy — what is the average trade worth? This is the one that matters: (how often you win × how much you win) − (how often you lose × how much you lose). A positive expectancy is the definition of an edge.
The trap is judging by win rate alone. A system that wins 70% of the time but whose rare losses are huge can have negative expectancy — it loses money while looking like a winner. A system that wins only 40% of the time but whose wins dwarf its losses can be very profitable. Win rate without win/loss size is half the story.
Why it matters in markets
Expectancy is the bridge from “signal” to “money”: a positive expectancy is what makes a strategy worth trading, and its size times the number of trades is your expected profit. It also dismantles the win-rate illusion through the break-even win rate — to profit, your win rate must clear
p_{\text{break-even}} = \frac{L}{W+L} = \frac{1}{1+R}.
With a 3:1 reward/risk ratio you need to win only 25% of the time; with a 1:3 ratio you need 75%. The figure plots that line: every system above it has positive expectancy, every one below it bleeds — no matter how flattering the win rate looks alone. This is also why negative-skew strategies (high win rate, occasional catastrophic loss — the ones flagged in Skewness & Kurtosis) are so dangerous: they sit just above the line until one giant loss drags the average below it. Expectancy is what Kelly sizes and what a healthy Sharpe reflects; win rate is what fools you.
A simple worked example
Two systems, opposite shapes:
- Trend system — wins 40% of the time, average win $300, average loss $100. Expectancy = 0.4(300) - 0.6(100) = +\$60 per trade; profit factor = \tfrac{0.4 \times 300}{0.6 \times 100} = 2.0. Break-even win rate is just 25%, so 40% is comfortably profitable.
- “Penny-picker” — wins 70% of the time, average win $50, average loss $150. Expectancy = 0.7(50) - 0.3(150) = -\$10 per trade; profit factor = \tfrac{0.7 \times 50}{0.3 \times 150} = 0.78. It needs a 75% win rate to break even, so 70% loses money.
The 40%-win system profits; the 70%-win system loses. Win rate ranked them backwards.
Python implementation
import pandas as pd

trades = pd.Series([...])          # per-trade returns (or P&L)

wins   = trades[trades > 0]
losses = trades[trades < 0]

win_rate      = len(wins) / len(trades)
profit_factor = wins.sum() / -losses.sum()
expectancy    = trades.mean()                       # = p*avg_win - (1-p)*avg_loss
reward_risk   = wins.mean() / -losses.mean()
print(round(win_rate, 3), round(profit_factor, 2), round(expectancy, 4))
Expectancy is simply the mean of the trade returns — the most honest one-line summary of an edge.
Manual / Excel calculation
With per-trade P&L in B2:B500:
| Task | Formula |
|---|---|
| Win rate | =COUNTIF(B2:B500, ">0") / COUNT(B2:B500) |
| Profit factor | =SUMIF(B2:B500, ">0") / -SUMIF(B2:B500, "<0") |
| Expectancy | =AVERAGE(B2:B500) |
Expectancy is just the average of the trade P&L — that single number is the edge.
Financial-market example — Nasdaq 100
A concrete system: buy NDX at the close after any down day and exit at the next close — a simple one-day mean-reversion. Over the full 2015–2026 history it fired 1,277 trades:
| Metric | Value |
|---|---|
| Win rate | 57.7% |
| Avg win / avg loss | 1.07% / 1.09% (R = 0.98) |
| Profit factor | 1.34 |
| Expectancy | +0.158% per trade |
| Break-even win rate | 50.4% |
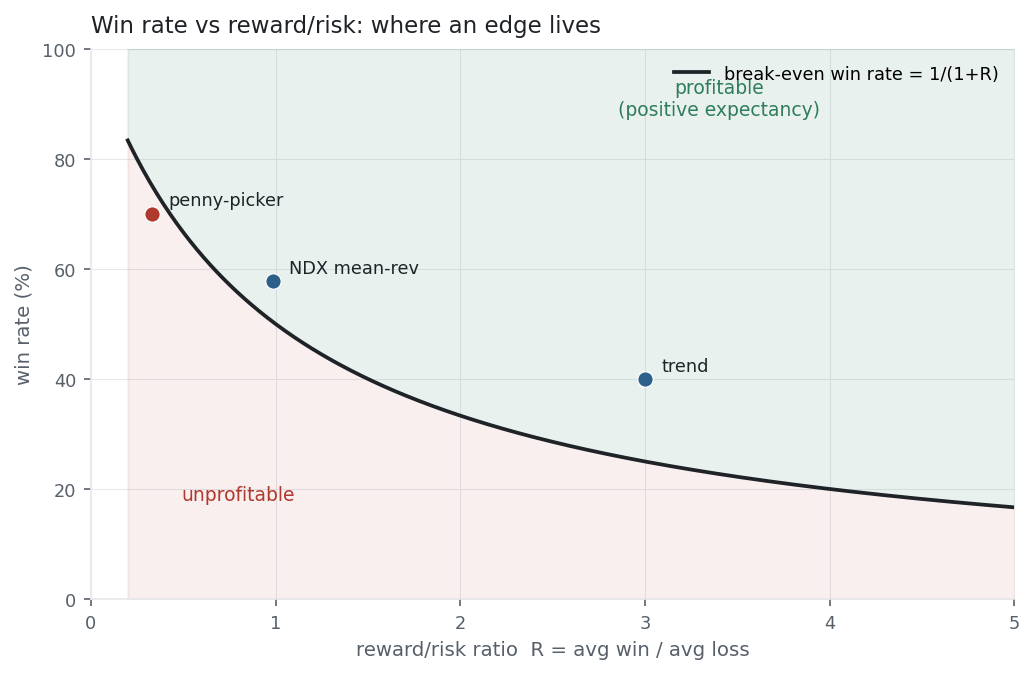
The edge is real but modest, and where it comes from is instructive. The average win and average loss are almost identical (R \approx 1), so this system makes money almost entirely by winning slightly more than half the time — 57.7% against a 50.4% break-even. Held against simply owning NDX every day (56.0% win rate, 0.076% expectancy), the “buy the dip” timing roughly doubles the per-day edge. On the break-even chart it sits just above the line — a genuine but thin edge, exactly the kind transaction costs can erase. Whether it survives costs and out-of-sample testing is a Quant Lab question, not an equation one.
Same multi_daily.csv as the previous entries (yfinance, adjusted closes). Code blocks are illustrative — every figure was computed and checked against that file.
Common mistakes
- Chasing win rate. A high win rate with fat losing trades has negative expectancy. Always pair it with the reward/risk ratio.
- Confusing profit factor with expectancy. Profit factor is the aggregate (gross win / gross loss); expectancy is per-trade. A high profit factor built on one lucky trade isn’t a repeatable edge.
- Ignoring the number of trades. Expectancy × trades = profit; a great per-trade edge over five trades is just noise.
- Forgetting costs and slippage. Commissions and spread come straight off expectancy — a 0.1% edge can vanish entirely.
- Trusting in-sample metrics. Win rate and expectancy measured on the data you built the rule on are optimistic; only out-of-sample numbers count.
- Mistaking a high win rate for safety. Negative-skew systems (selling options, martingales) win often and blow up rarely — high win rate, catastrophic tail.