Model Explainability
Opening the black box — what the model uses, how it uses it, and why the default answer misleads
The last few pages asked whether a backtest is honest. This one asks something different: what is the model actually doing? A random forest or gradient-boosted model that scores 0.58 AUC is a black box — hundreds of trees voting — and before trusting it with capital you want to know which features it relies on, how it uses them, and whether what it learned is economics or artifact. Explainability is the toolkit for those questions. And it opens with a warning worth the whole page: the feature-importance number nearly everyone looks at first — the default impurity importance — is biased, and in the demonstration below it confidently ranks a planted random-noise feature third out of five.
1. What problem does it solve?
Turning “the model predicts X” into “the model predicts X because…”. Concretely: which features drive predictions (importance), what is the shape of each feature’s effect (dependence), and why did the model make this particular prediction (attribution). For a quant this is not cosmetic — an unexplained signal cannot be sanity-checked against market logic, cannot be debugged when it decays, and should not be sized up with real money.
2. What are the two kinds of explanation?
Global explanations describe the model’s overall behaviour — which features matter on average, and what the learned relationships look like across the dataset. Local explanations account for a single prediction — why this day was scored high-risk. Importance and dependence plots are global; attribution methods (LIME, and SHAP on the next page) are local, though SHAP aggregates into global views too. A second axis: model-specific tools (a tree’s split counts, a linear model’s coefficients) versus model-agnostic ones (permutation, partial dependence) that treat any model as a function to probe.
3. Why is the default importance biased?
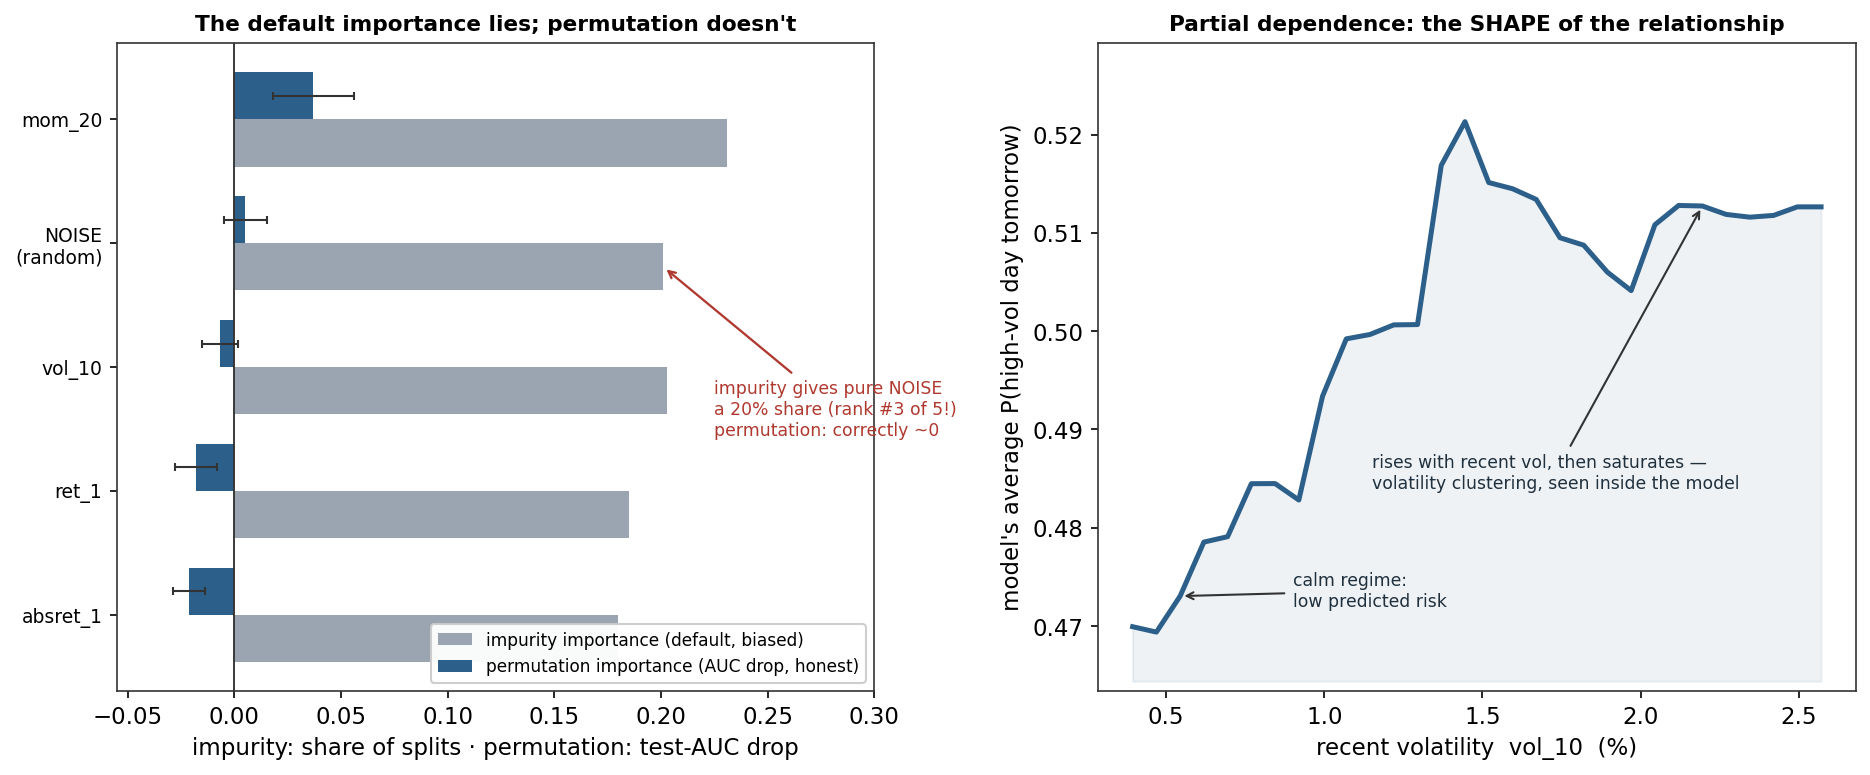
Tree ensembles ship with impurity importance — each feature’s share of the total impurity reduction across all splits, measured on the training data. Two flaws make it misleading. It favours features with many possible split points — a continuous or high-cardinality feature offers the tree endless ways to fit noise, so it accumulates splits and credit regardless of real signal. And it reflects training-set fitting, not out-of-sample prediction — a feature the trees used to memorise noise counts as “important”. The left panel is the demonstration: I added a pure random-noise feature to a Nasdaq volatility model, and impurity importance hands it a 20% share — rank #3 of five, indistinguishable from real features. Anyone reading that chart would conclude the noise mattered.
4. What are the honest tools?
Permutation importance asks the operational question: how much does test performance drop when this feature’s values are shuffled? Shuffling destroys the feature’s relationship with the target while keeping its distribution; if the model’s test AUC falls, the model genuinely relied on it. It is measured out-of-sample, is model-agnostic, and on the same model it tells the truth: the noise feature scores ≈ 0 (+0.005), while 20-day momentum emerges as the only feature with a decisive AUC contribution (+0.037) — consistent with the feature-engineering finding that trend features carry the volatility signal through the leverage effect. Its one caveat: correlated features share credit (shuffle one and its twin covers for it), which is visible here in the small, noisy scores of the overlapping volatility features.
Partial dependence shows the shape: sweep one feature across its range, hold the data otherwise fixed, and plot the model’s average prediction. The right panel sweeps recent volatility: predicted probability of a high-volatility day tomorrow rises steeply as recent volatility climbs from calm to about 1.5%, then saturates — the model has learned volatility clustering, and the plot lets you see that it learned the economically sensible shape rather than something pathological. (Its caveat: it assumes the swept feature can move independently of the rest, which strains credulity for strongly correlated features.)
5. What are its strengths?
- Catches nonsense before it costs money. A model leaning on a data artifact, a leaked column, or noise shows up immediately in honest importance.
- Builds justified trust. Seeing the model use sensible features with sensible shapes (rising, saturating volatility dependence) is evidence it learned structure, not accident.
- Model-agnostic tools work on anything. Permutation and partial dependence treat the model as a function — forest, boosting, or neural net alike.
- Debuggable signals. When a signal decays live, knowing what it depended on tells you where to look.
6. What are its weaknesses?
- The default is a trap. Impurity importance is biased toward high-cardinality features and training-set fitting — the demonstration’s whole point.
- Correlated features confound everything. Permutation splits credit across correlated twins; partial dependence sweeps features into unrealistic combinations.
- Explanations are correlational. They describe what the model uses, not what causes the market outcome.
- Global summaries hide local behaviour. An “unimportant” feature on average may drive specific predictions — the gap SHAP fills.
- Explaining ≠ validating. A beautifully explained model can still be overfit; explainability complements, never replaces, the validation discipline.
7. How could it apply to markets?
Directly, and with a specific workflow. Before trusting any MarketLens signal: compute permutation importance on held-out data (never the impurity default alone) and check that what the model relies on makes economic sense; plot partial dependence for the top features and check the shapes against known market behaviour — a volatility model should show clustering, as here; and treat any importance concentrated in a suspicious feature as a leakage or artifact alarm — an honest importance measure is one of the best leak detectors there is, because a leaked column will dominate it. The demonstration’s verdict doubles as a market finding: momentum, not lagged volatility itself, carried the out-of-sample volatility signal — the leverage effect again — and the impurity chart would never have told you that.
8. What does the Python code look like?
from sklearn.inspection import permutation_importance, PartialDependenceDisplay

model.fit(X_train, y_train)

# DON'T stop at the default (biased toward high-cardinality, training-fit features):
model.feature_importances_                    # impurity importance — treat with suspicion

# DO measure what matters out-of-sample:
pi = permutation_importance(model, X_test, y_test,          # TEST set, honest metric
                            n_repeats=30, scoring="roc_auc")
print(sorted(zip(pi.importances_mean, features), reverse=True))

# and look at the SHAPE of the top features' effects:
PartialDependenceDisplay.from_estimator(model, X_train, ["vol_10", "mom_20"])
The habits: permutation on the test set with the metric you care about, error bars from n_repeats, and partial-dependence plots for every feature you intend to rely on. Add a planted-noise column as a canary — any method that ranks it highly is lying to you.
9. How would I explain it to a supervisor?
“Explainability is the toolkit for asking what a model actually does: which features it relies on, the shape of each effect, and why it made a specific prediction — global versus local. The key practical warning is that the default tree feature importance is biased: it’s the training-set impurity reduction, which favours features with many split points. I demonstrated it — a planted random-noise feature got a 20% share, third of five. The honest measure is permutation importance on held-out data: shuffle a feature and measure the test-AUC drop. It zeroed the noise and showed 20-day momentum was the one feature that mattered, consistent with the leverage effect. Partial dependence then shows the shape — my volatility model’s predicted risk rises with recent volatility and saturates, which is volatility clustering learned correctly. In practice I use permutation plus partial dependence as both a trust check and a leak detector, and SHAP for per-prediction attribution.”
Random forest on the Nasdaq next-day volatility task (four point-in-time features plus one planted standard-normal noise feature; same multi_daily.csv, 70/30 time split). Impurity importances from the default deep forest; permutation importance on the test set (scikit-learn, 30 repeats, ROC-AUC); partial dependence from a depth-limited forest for a stable curve. Every number was checked.